Agriculture Reference
In-Depth Information
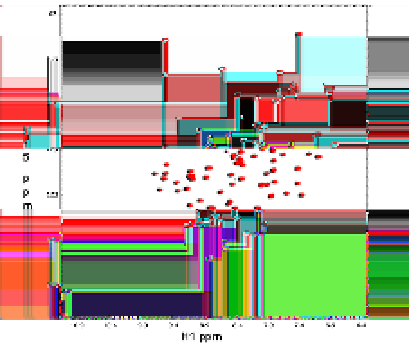
Figure 6.
HSQC of the uniformly
15
N-labeled KID-binding (KIX) domain of CREB-binding protein (CBP), residues
586-672 (black). Overlaid is a spectrum of KIX in the presence of 0.4M
myo
-Inositol (red) showing the intactness of the
three-dimensional protein folds upon the addition of an osmolyte. Spectra were acquired on a Varian Inova 800MHz
spectrometer at 26.9
o
C
Nuclear Magnetic Resonance (NMR) spectroscopy has greatly contributed to understanding
of protein folding by characterizing protein conformation at the level of individual amino
acid residues. NMR techniques can be used to monitor temperature dependence of folding
and unfolding in order to determine their thermodynamic properties, measure sensitivity to
denaturants and address solvent and co-solvent accessibility. NMR experiments provide in‐
formation at multiple sites within the protein, unlike spectroscopic techniques such as circu‐
lar dichroism that provide nonspecific information about aromatic side chains and averaged
properties of the polypeptide backbone. Heteronuclear NMR relaxation and relaxation dis‐
persion experiments have emerged as powerful tool to study internal dynamics under a
wide range of experimental conditions.
NMR relaxation experiments
Information about protein dynamics, extracted form heteronuclear NMR relaxation studies,
is based on measurements of the longitudinal (T1) and transverse (T2) relaxation rate and
the heteronuclear NOE, all sensitive for the motion of the N-H bond vector in the protein
backbone [11]. Fast atomic motions on a picosecond to nanosecond (ps-ns) time scale are
gained from the slower relaxation processes (R1, R2 and NOE) of nuclear spins, measured
along the backbone and in the side chains using isotopically labeling (
15
N).
Relaxation data (T1, T2, NOE) can be interpreted according to the "model free" formalism in
terms of the internal motional correlation time and an order parameter (S
2
) [48]. In the NMR
experiment, order parameters (S
2
) report on the refinement of the N-H bond vector. The val‐
ue of S
2
varies from 0 (no motional restriction) to 1 (complete motional restriction) [49].
Backbone segments in highly flexible parts of the protein, not restricted in their motion,
have low S
2
values, whereas rigid regions show typical high S
2
values. Main chain
15
N relax‐
ation data can be analyzed to yield S
2
order parameters on a per residue basis (Figure 7).
Search WWH ::

Custom Search