what-when-how
In Depth Tutorials and Information
complementary information, were used in early analy-
ses to demonstrate that the mineral in OI bone was
apatitic, and suggest that it was smaller and
/
or less
crystalline than that in aged-matched controls. With
the addition of imaging detectors, which allow separa-
tion of the spectra in different areas of the tissue, more
detailed information was provided on the spatial distri-
bution of different compositions.
Raman imaging has the advantage of very high spa-
tial resolution and no interference by water, enabling
wet tissues to be examined. However, to image a large
area of bone, e.g., a whole mouse tibia, takes more
time than the examination of multiple thin sections
of the same bone by FTIR imaging (FTIRI). The FTIRI
experiment relies on the transmittance of light through
the specimen, thus thin sections (1-3 microns) are
required, and water interferes, thus the tissue must be
dehydrated (with alcohols) and embedded for section-
ing prior to analysis. The mineral peaks, however, are
stronger in FTIR than in Raman, and thus they can be
analyzed to provide more detailed information on com-
position.
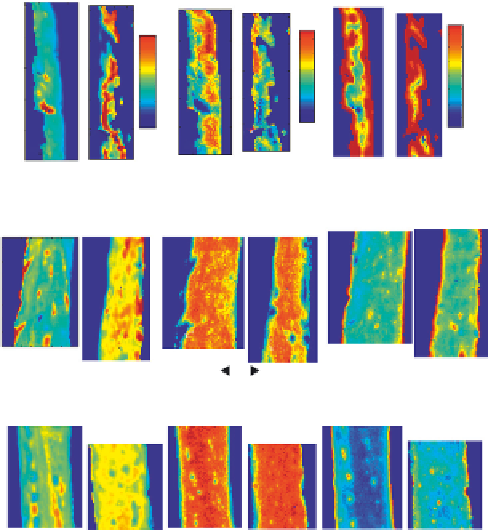
Figure 4.4
shows examples of the multiple
parameters that can be imaged in mouse tibias of a vari-
ety of different models of OI and their respective age-
and sex-matched control tissues. These parameters may
include the amount of mineral present per matrix (min-
eral
/
matrix ratio), the extent of carbonate substitution,
the type of carbonate substation, a parameter linearly
related to the crystal size and perfection as measured by
X-ray diffraction (XST), the acid phosphate content, and
a measure of collagen maturity (XLR).
42
In OI, such analyses have documented the decreased
crystallinity (a measure of both crystal size and perfec-
tion) in classic OI and in patients with the high bone
density form of OI,
3
the altered collagen maturity in
all forms of human and animal model OI examined to
date, and the altered distribution of mineral (mineral
/
matrix) as summarized in
Table 4.1
. One of the first
FTIR microscopy studies of OI bones demonstrated the
presence of additional acid phosphate substitution in
the bone mineral crystals.
48
This finding was thought to
be due to the presence of more newly formed mineral
on the smaller crystals, indicating an impaired mineral
deposition. This increase in acid phosphate content is
visible in the different forms of mouse OI pictured in
Figure 4.4
. Altered patterns of collagen crosslinking
were noted in such images (see
Table 4.1
), and could
be related to changes in D-spacing
38
or other markers
of collagen maturation in the mutant animals. Other
FTIRI studies were used to define the effects of differ-
ent potential therapeutics on oim
/
oim and other mouse
models. Alendronate treatment of the oim
/
oim mouse
reduced fracture rate and increase bone volume but did
not alter any of the FTIRI parameters or other material
properties.
43,49
FTIR images also helped describe the collagen and
collagen crosslink (collagen maturity) distributions that
were decreased in most OI. This finding is not unex-
pected based on the abnormalities in the collagen mol-
ecules which might impede their proper alignment,
and in view of the alteration in collagen fibrils seen at
the electron microscopic level. It should be noted that
each of the techniques discussed above were capable of
describing both mineral and matrix changes associated
with OI. There are other techniques that are more spe-
cific for mineral analyses.
Mineral/Matrix
XST
Acid Phosphate
10 D
0.7
12
1.2
10
8
6
4
2
1.15
1.1
1.05
1
0.95
0.6
0.5
0.4
opt
opt
WT
WT
2 Mo
WT
WT
WT
Brtl
Brtl
Brtl
6 Mo
WT
WT
WT
oim
oim
oim
Mineral Analyses
X-RAY DIFFRACTION
Wide-angle X-ray diffraction is the “gold standard”
for mineral crystal analysis, and has been used for half
a century to provide insight into the mineral composi-
tion and assessment of the crystal size in bone. A key
study, by Vetter et al., investigated bone biopsies from
the four Sillence types of OI cases, both children and
adults, and found decreased HA crystal size in each
childhood case relative to age-matched control bones.
50
FIGURE 4.4
Images showing the different FTIR parameter dis-
tributions in tibias of mouse models of OI and their wild-type coun-
terparts as a function of age; cortical bone only. Line 1: Osteopotentia
(opt) KO and its wild-type WT control at 10 days of age. Line 2: Brtl
IV mice (Brtl) and its WT at 2 months of age. Line 3: Oim
/
oim mice
and its WT at 6 months of age. The parameters shown are mineral
/
matrix, crystallinity and acid phosphate content. Since all WT are in a
B6 background the progression with age in each of these parameters
in normal animals can be observed by examining the WT.