what-when-how
In Depth Tutorials and Information
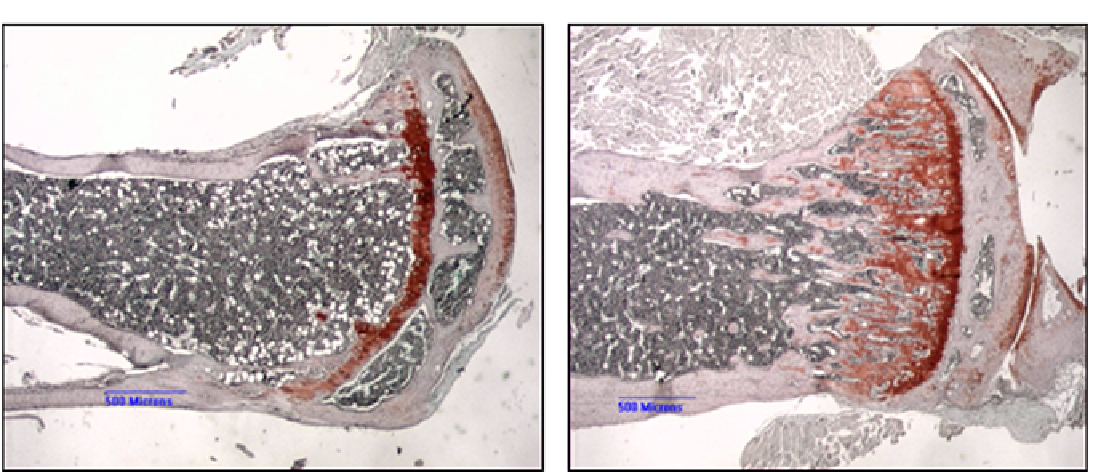
FIGURE 4.1
Typical histochemical stains used to study bones. (A) Six-month-old oim
/
oim mouse tibia stained with Saffranin-O to reveal
cartilage and cartilage cores, showing normal growth plate, very few trabeculae, and narrow cortex. (B) Age-matched wild-type mouse tibia
showing normal growth plate with developing primary trabeculae and normal cortex. Scale bars = 500 microns.
from both McKusick and Follis more than 60 years ago
were that OI was a problem related to collagen synthesis,
probably involving osteoblast function.
In 1971, Doty and Mathews
31
carried out an electron
microscopy study of osteogenesis imperfecta tarda on
four patients (5-11 years of age) in which it was observed
that the osteocyte population was separated by less
lamellar bone between osteocytes, suggesting that there
was less bone formation occurring in this disease. The
electron microscopic cellular details will be described in
the section “FTIR and Raman Microspectroscopy and
Imaging,” below, but the study pointed towards a defect
in osteoblastic activity. In 1973, a thorough histological
study of osteogenesis imperfecta congenita (11 patients)
and osteogenesis imperfecta tarda (six patients) was car-
ried out by Falvo and Bullough.
32
The most significant
difference between these forms of OI was the presence
of more woven bone and much larger osteoid seams in
congenita, with more lamellar bone present in the tarda
form. Both forms, compared to normal bone, showed
decreased bone fraction area, increased numbers of
osteocytes per area of bone, and significant osteoclastic
resorption on many surfaces.
In 1979, Sillence described the heterogeneity in OI
33
which differentiated the congenital and tarda forms into
four separate conditions, types I, II, III and IV. Type II is
lethal, so quantitative histomorphometry was only done
on types I, III and IV,
27
although more recently histomor-
phometric data from patients with the “non-classical”
forms of OI have also been reported.
34
The initial stud-
ies
27
showed that there was a defect in the modeling of
the whole bone during early growth so that the external
size and the cortical width were greatly decreased. The
number of osteoblasts per bone surface was increased
for all three OI types compared to controls; however,
the mineral apposition rate was decreased for all OI
samples indicating that the osteoblasts were not making
bone matrix at the same rate as the controls. This might
explain the thin trabeculae present in the OI samples.
The yearly increase in trabecular thickness in the con-
trols averaged 5.8 microns, whereas the increase in OI
trabeculae averaged only 3.6 microns. The bone forma-
tion rate per osteoblast covered surfaces was higher in
the control compared to OI; however, the formation rates
were the same for all three OI conditions suggesting that
the severity of the disease among the three OI types did
not correlate with the amount of bone formed. Similar
histomorphometric results were found by Roschger
et al.
34
studying only OI type I patients who reported
reduced bone size, thin cortex, less trabecular volume
and increased numbers of osteoblasts per surface of bone.
However, among their 19 patients (2-14 years old) some
had mutations in the COL1A1 gene (frameshift mutations
or stop codons) and some had qualitative mutations (gly-
cine substitutions). There were no significant morphomet-
ric differences between these two groups, suggesting that
collagen structure by itself is not responsible for the min-
eralization and other tissue characteristics of OI disease.
However, as we will see in the next section, collagen fiber
size is a known variable among the OI types.
ELECTRON MICROSCOPY
Electron microscopy has been used to characterize cell
morphology, collagen distribution and mineral orientation,