what-when-how
In Depth Tutorials and Information
the external size of the biopsy core did not increase
with age, and cortical width was generally markedly
below normal.
11
Because external bone size and corti-
cal width during growth are determined by modeling
processes,
12
these observations suggested a modeling
defect in OI. This is an important aspect of the disease
because deficient bone modeling will result in smaller
cross-section and thinner cortices of long bones and
thus reduced bone strength.
In addition to diminished external size and cortical
width, OI is also characterized by a low amount of can-
cellous bone, which is largely due to decreased trabecu-
lar number (
Figure 25.1
). Low trabecular number was
also found in a study in adults using high-resolution
peripheral quantitative computed tomography.
13
Low
trabecular number can result from either increased loss
or decreased production of trabeculae. There was no
evidence that children with OI lose secondary trabecu-
lae because trabecular number remained constant with
age. By exclusion, this suggested that fewer secondary
trabeculae are produced. Trabeculae consist of lamel-
lar bone, but lamellae tend to be thinner than those in
healthy children.
Inadequate trabecular thickening in OI is caused
by a defect in bone remodeling. In the control group,
each remodeling cycle added 2.8 µm more bone than
it resorbed. In OI type I, the positive balance was
only 1.1 µm and it was approximately 0 in types III
and IV. The insufficient performance of the osteo-
blast team in all OI types was the consequence of the
fact that the amount of work achieved by an indi-
vidual cell was decreased by approximately 50%.
11
This was only partly compensated by an increased
number of osteoblasts per remodeling unit. Although
the amount of bone turned over in individual remod-
eling cycles is decreased in OI, the number of remod-
eling cycles that occur on a given bone surface per
unit time is increased. Similar observations had been
made before in smaller study cohorts.
14
The cause of
increased recruitment of remodeling teams is not clear,
but increased microdamage in the bone matrix due to
impaired mechanical resistance is the likely cause, as
has been found in a mouse model of OI.
15
This study showed that in OI a single genetic defect
in the osteoblast interferes with multiple mechanisms
that normally ensure adaptation of the skeleton to the
increasing mechanical needs during growth.
16
Much less is known about histomorphometric features
of adult OI. However, two case series found normal or
reduced activity of bone remodeling in iliac bone sam-
ples of adults with OI.
17,18
It is thus possible that remod-
eling activity decreases from the high levels that are
consistently found during bone development to normal
or even abnormally low rates of bone turnover.
The Influence of Vitamin D Status on OI Bone
Tissue
Vitamin D plays an essential role in calcium homeo-
stasis and in the development and maintenance of the
skeleton.
19
One could hypothesize that children with
underlying bone fragility such as OI should be espe-
cially vulnerable to the additional challenge of a low
vitamin D status. A study on 71 patients with a diag-
nosis of OI type I, III or IV from age 1.4 to 18 years
therefore investigated the relationship between serum
25-hydroxyvitamin D (25OHD) levels and histomorpho-
metric parameters.
20
None of these patients had received
bisphosphonate treatment before iliac bone biopsy.
Serum 25OHD levels ranged from 13 to 103 nmol/L and
were in the deficient or inadequate range (<50 nmol/L)
in 37 patients (52%). None of the OI patients had radio-
logical signs of rickets or fulfilled the histomorphometric
criteria for the diagnosis of osteomalacia (i.e., elevated
results for both osteoid thickness and mineralization lag
time). Serum 25OHD levels were not correlated with any
parameter of bone mineralization or bone mass. Thus,
no evidence was found that serum 25OHD levels in the
range from 13 to 103 nmol/L were associated with mea-
sures of bone mineralization, metabolism or mass in chil-
dren with OI.
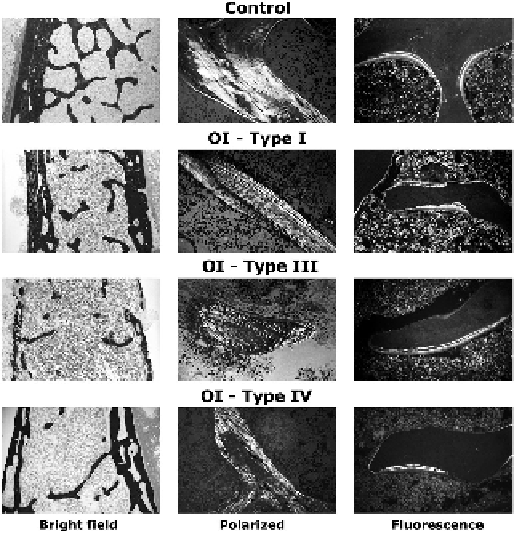
FIGURE 25.1
Typical sections of biopsies from a control sub-
ject (boy, 9 years) and OI patients (type I: girl, 5 years; type III: boy,
9 years; type IV: boy, 13 years). Original magnifications: left column,
32×; middle column, 200×; right column, 200×.
(From: Rauch F, Travers
R, Parfitt AM, Glorieux FH. Static and dynamic bone histomorphometry in
children with osteogenesis imperfecta. Bone 2000;
26
: 581-9.)