In the main display window you see the complete status line for each process (you get to select
what to display). This is data that is derived from the /proc file system. Selecting one of those,
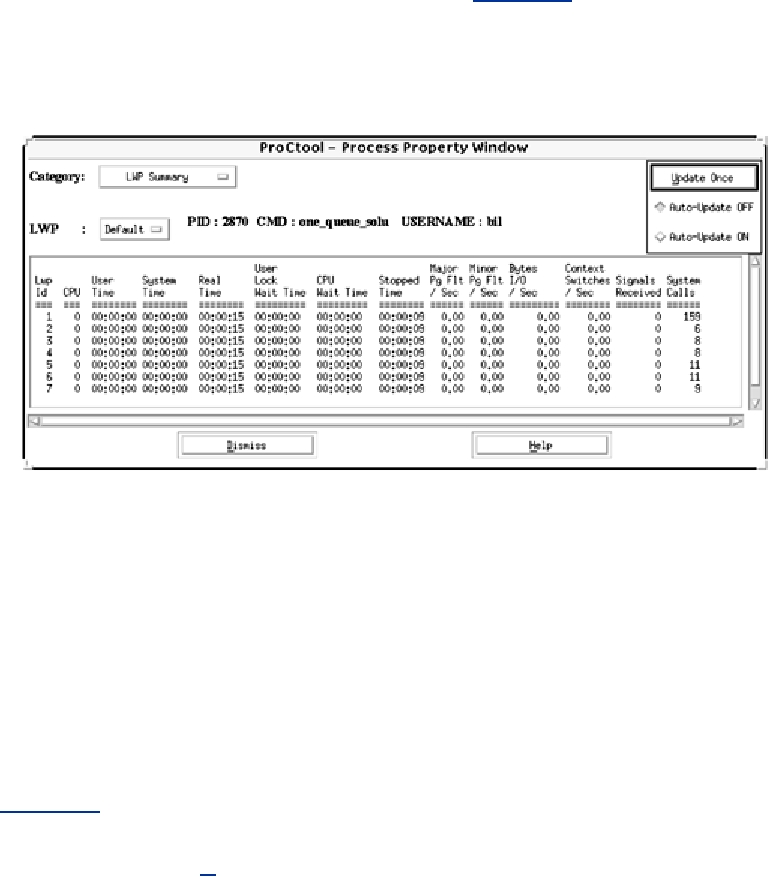
you can look at detailed information about that process. In Figure 14-3 you see the detailed
statistics for each LWP. (This is one of the places where it's nice to have bound threads, because
you get to see what each individual thread is doing.)
Figure 14-3. Proctool, LWP Display Window
TNFview
Many of the new, multithreaded kernels have internal instrumentation in both the kernel and
standard libraries. In Solaris, this instrumentation takes the form of a TNF (trace normal form)
probe. The basic idea for all these types of instrumentation is that probes are included in various
important routines. These probes write their names into the file and, optionally, details of the
current program state (i.e., some variable values) into a file, along with the exact time of the call.
The probes are normally turned off but can be enabled when timing data is desired.
In Figure 14-4 we see calls to TNF_PROBE_N() (N is the number of data values that the probe
will write out) in the Pthread library code, in the UNIX kernel, and even calls that we included in
our own code. When we run the program with tracing enabled, the probes will write their
information out into a file.[1] The timing information is based on the high-resolution clock, which
is part of all new Sun hardware. That clock can be read directly (no system call required) with a
resolution of 10 µs.
[1]
Actually, it's a bit more complicated than we show, as there is an intermediate, binary format
between the probe and the human-readable file. Kernel probes write out to an internal buffer
instead of a file, so that must be merged into the final output.
Figure 14-4. Data Collection for TNF
Search WWH :