What is animation in Maya? One answer is: values that change over time. Think of the pattern we have established in our animation exercises: time-value-key to set DHUJ the first keyframe, change time-value-key to set the second, and so on. This process is used to lay down the foundation of your animation, the key poses. However, the keys only tell part of the story when it comes to animation. What happens in between the keyframes is just as important.
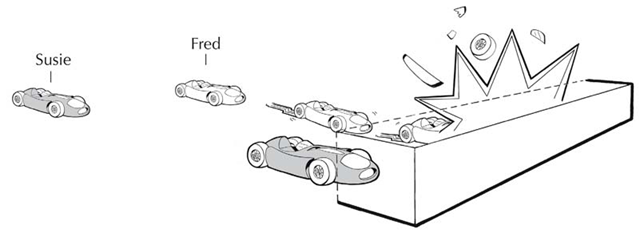
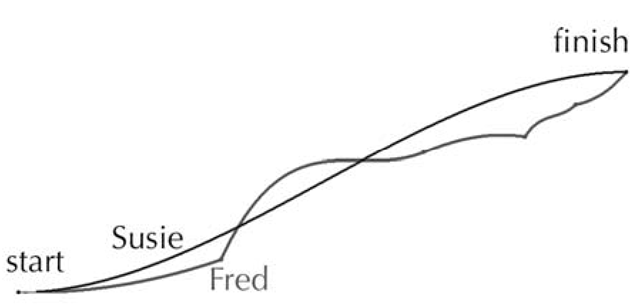
Imagine this. There’s a drag race between two cars, one driven by Susie and one by Fred. When the light turns green, both drivers hit the accelerator. Susie’s tires grip the road; she takes off smoothly, reaches top speed, sees a brick wall at the end of the track, slows down, and comes to a complete stop, her bumper just touching the wall. Her time: 30 seconds flat. Simultaneously, Fred’s bald tires squeal, smoke, and slip for the first 20 seconds of the race. Then, suddenly, he gains traction, shoots down the road at an insane speed, fails to see the brick wall and slams right into it, coming to a complete and sudden stop. Thankfully, Fred’s airbag deploys and he escapes injury. Fred’s time: also 30 seconds flat.
What is the moral to this gripping story? Susie and Fred started and stopped their cars at exactly the same time and place, but they had wildly different experiences during the race. In animation terms, they had identical keyframes; it was the in-betweens that made all the difference (see Figures 3.34 and 3.35).
Figure 3.34: Drag racin’
Figure 3.35: Function curves of the race
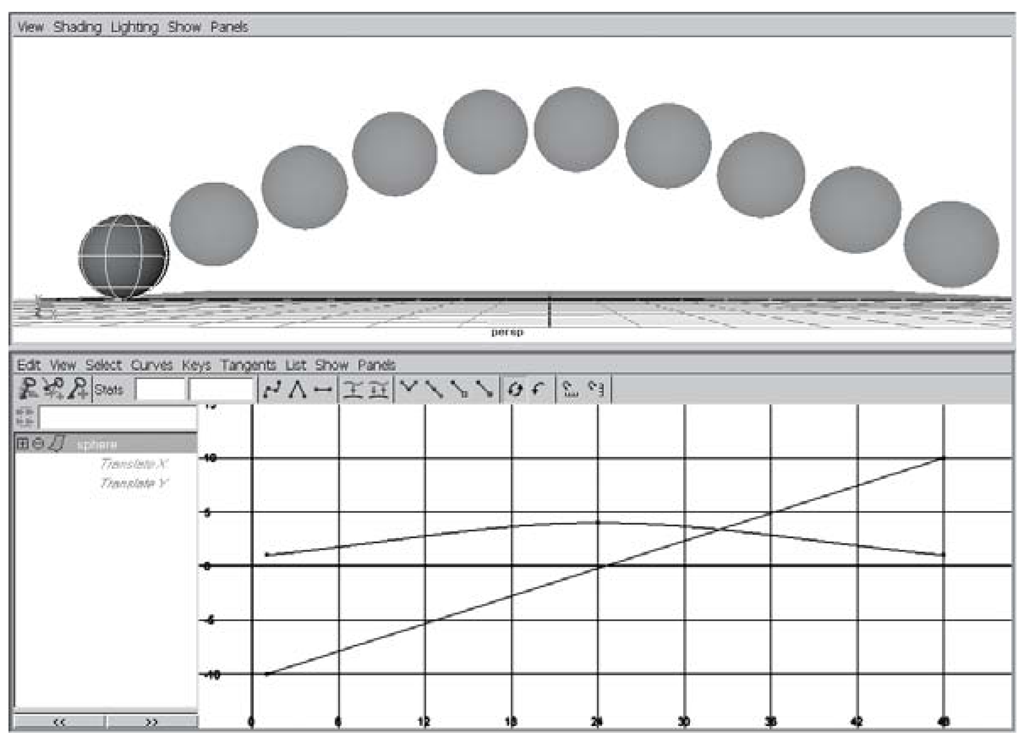
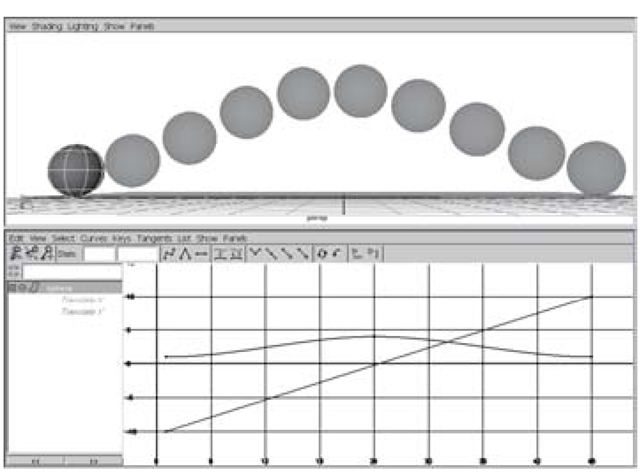
To have precise control over the timing of your animation you must use the Graph Editor. The Graph Editor is your home base for tweaking the value and timing of your keyframes. Look at the simple animation and the corresponding Graph Editor view in Figure 3.36.
Figure 3.36: Function curves
The vertical axis in the Graph Editor represents value while the horizontal axis represents time. Notice that the ball is animating on the Y-axis from 1 to 4 and back to 0 over the course of 48 frames. It travels along the X-axis from -10 to 10.
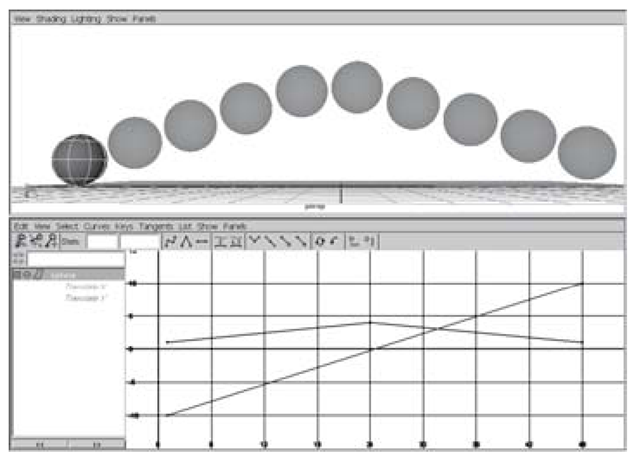
If you were to move the keyframe at frame 24 to the left (say to frame 10) the ball would bounce up to its full height very quickly.
Another important thing to notice is how the curvature of a set of keyframes in the Graph Editor mimics the motion’s timing and acceleration in the actual animation. If you were to rotate the Bezier handles of a keyframe, the timing of the ball will change to represent a sudden acceleration and gradual deceleration. Try changing the type of line with the Graph Editor’s Tangents menu and play back your animation. What kind of animation will these different splines produce?
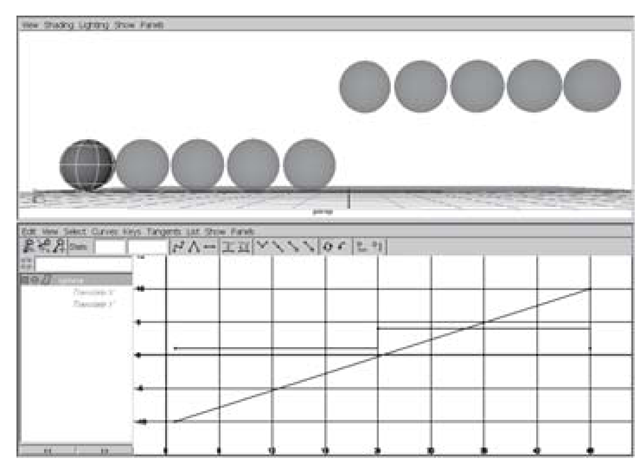
In Figures 3.37 – 3.39, the keyframes have remained the same, but the in-between frames have changed dramatically.
Figure 3.37: Linear tangents
Figure 3.38: Flat tangents
Figure 3.39: Stepped tangents
